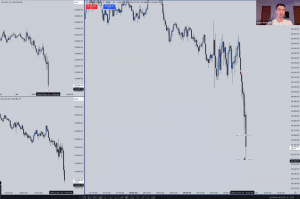
In this video, I’m demonstrating over live price action on the Nasdaq NQZ futures with my group, specifically focusing on why marking the previous day’s highs and lows (up to a 3-day lookback) on your charts provides a consistent supply of setups. This is not just limited to daily highs and lows but also extends to time-based liquidity levels, including session highs and lows, which are valuable to mark out as well.
Institutions and banks place significant orders at these levels, making them key targets for the algorithm to refer back to and revisit, providing an easy draw on liquidity to aim for at specific times of the day. This allows smart money to distribute their positions into the opposing liquidity that rests above and below these institutional reference points.
The concept of the first presentation Fair Value Gap (FVG) was also highlighted. It’s an excellent tool for reading institutional order flow intraday, especially when extended throughout the trading day as a strong and sensitive algorithmic price delivery array. Post-9:30 AM, a displacement away from this FVG indicates that the algorithm is in an expansion profile and in a hurry to reprice into set targets. This gives the confidence to hold for larger price runs, understanding which liquidity pools price is actively seeking, whether higher or lower.
Failure to see a clear displacement from these FVGs indicates potential consolidation profiles or high-resistance price runs to be expected. This feedback is crucial for you, as the trader and operator, to decide whether to cut your risk exposure or close your position entirely.
Key Takeaway: Understanding institutional order flow empowers you to trade with greater confidence, knowing how these factors when combined to create a comprehensive price narrative.


